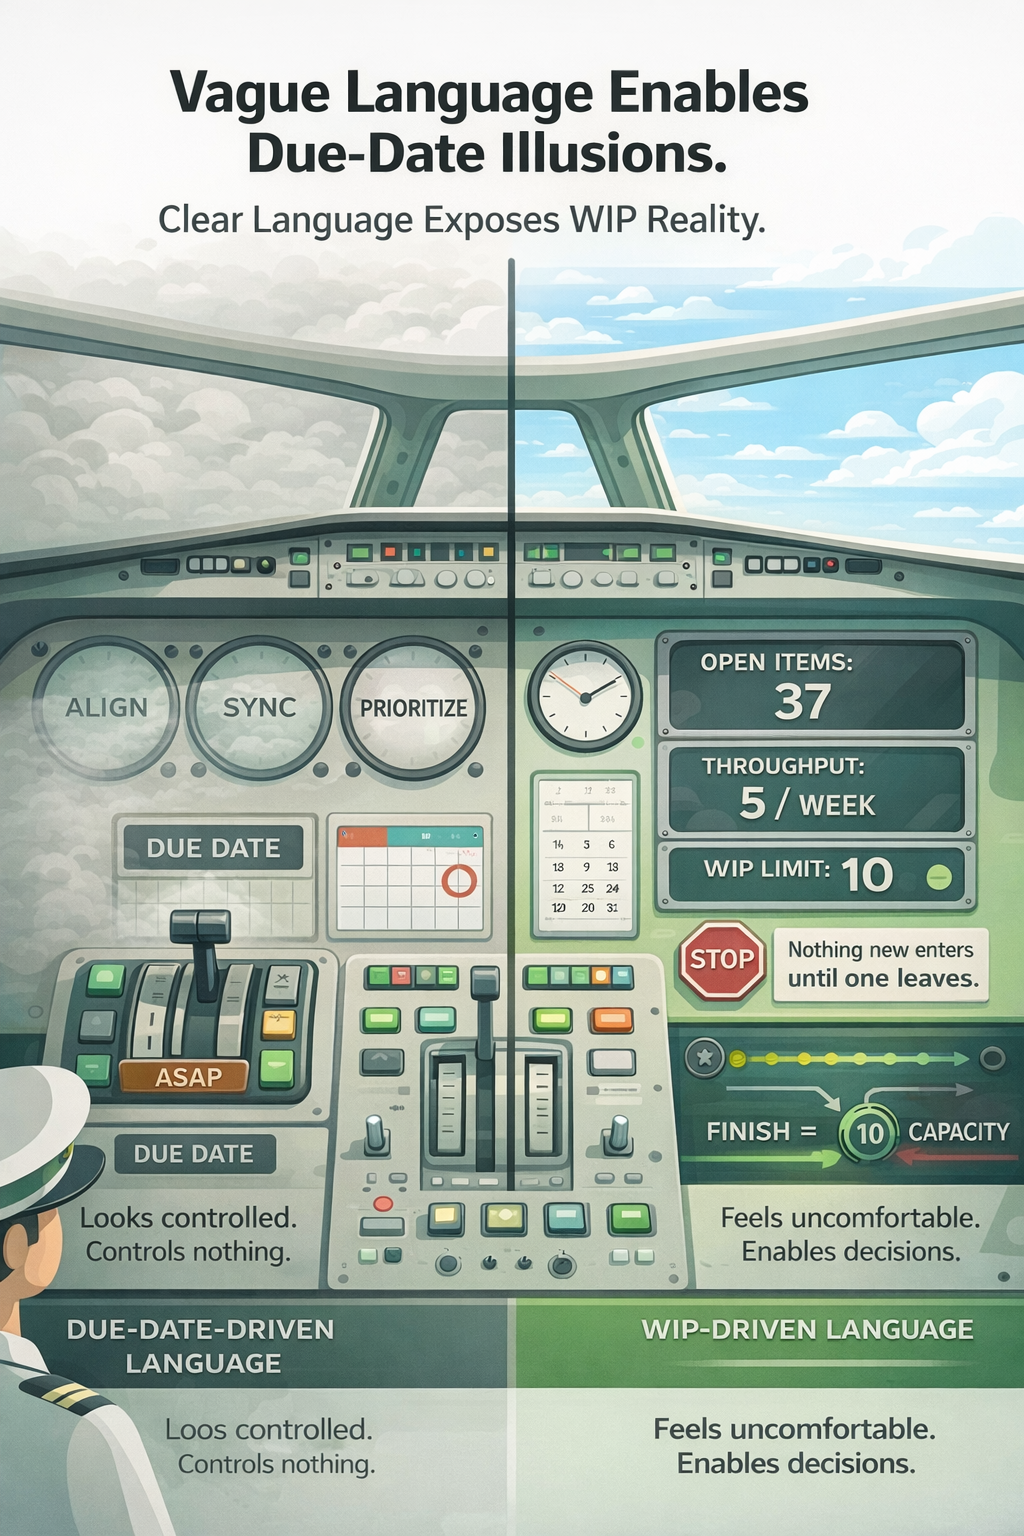
Why visibility is the foundation of real quality in QC & QA.
The Illusion of Green DashboardsIn QC and QA, this sentence is both a warning and a promise:
Without measurement, there is no understanding.
Without understanding, there is no action. And without action, there is no quality.
A pharmaceutical company recently shared an experience that illustrates this with painful clarity.
- On paper, their quality performance looked excellent.
- Monthly dashboards were consistently green.
- Deviation reports appeared clean and controlled.
- Audit readiness was always marked as “on track.
But the shop floor told a very different story.
- Operators were firefighting.Batches waited for decisions far longer than anyone realized.
- Rework quietly accumulated in places no dashboard ever reflected.
- And leadership remained confident… because “the report says everything is fine.
When Paper Quality Collides with Reality
The turning point came with a single batch recall and triggered by a small, avoidable defect. A defect that could have been identified within minutes, if someone had actually been at the line instead of polishing another perfect report.
That incident exposed a critical truth:
- Quality was being documented, not experienced.
- Measured, but not understood.Reported, but not lived.
Because the reality is simple:
- Quality does not live in PDFs, dashboards, or GxP templates.
- Quality lives where the work happens - in the data, in the flow, in the everyday decisions on the line.
Seeing the System for the First Time after the recall, the company changed its approach.
- They stopped assuming that green dashboards meant stable processes.
- They went to the line, spoke with operators, followed the material flow, and compared real cycle times with the reported ones.
The discrepancies were not minor. Tthey were systemic:
- Decisions took hours, not minutes.
- Rework was invisible in the reporting chain.
- WIP piled up without ownership.
- Deviations were treated as symptoms, not causes.
For the first time, they saw the difference between paper quality and actual quality.
And once they saw it, they could act on it.
- Visibility created understanding.
- Understanding created action.
- Action created quality.
How q_alizer Turns Visibility Into Flow
What this pharmaceutical company learned is exactly what q_alizer is built for: transforming data into real operational visibility and visibility into action.
q_alizer closes the gap between what is reported and what is truly happening by:
1. Making the real process visible q_alizer unifies QC and QA data streams into one flow-based view. No silos. No isolated dashboards. Just one truth of how work actually moves through the system. It reveals:
- real cycle times
- waiting times
- bottlenecks
- WIP levels
- decision delays
It shows the flow as it truly happens.
2. Detecting hidden work and silent delays Rework, loops, overdue tasks, and repeated investigations become visible immediately. No more hidden corners. No more blind spots.
3. Turning data into actionable insights q_alizer highlights discrepancies between “paper reality” and “actual reality,” making it instantly clear where:
- decisions stall
- tasks queue
- ownership breaks
- throughput collapses
Insights point directly to actions and not to more reporting.
4. Creating a culture of fact-based quality q_alizer shifts conversations from opinion to evidence. Not “we think the process is stable,” but “here is where flow stops and this is why.”
5. Enabling continuous improvement at scale Because everyone sees the same truth, improvement becomes systematic, measurable, repeatable andnot accidental.
Conclusion
Quality improves the moment reality becomes visible and q_alizer makes that visibility operational.
When measurement reflects the real system instead of a reported one, QC and QA stop fighting symptoms and start improving flow.
This is how organisations move from green dashboards to real, sustainable quality.